• Skip to main content
  • Skip to primary sidebar
  • Skip to footer

Microsoft Excel Tips and Tricks - Computergaga

  • Home
  • Excel Online Courses
  • Excel Functions List
  • Free Downloads
  • Blog
  • Tutorials
  • About
Home / Archives for Downloads

Euro 2016 Planner – Excel Template

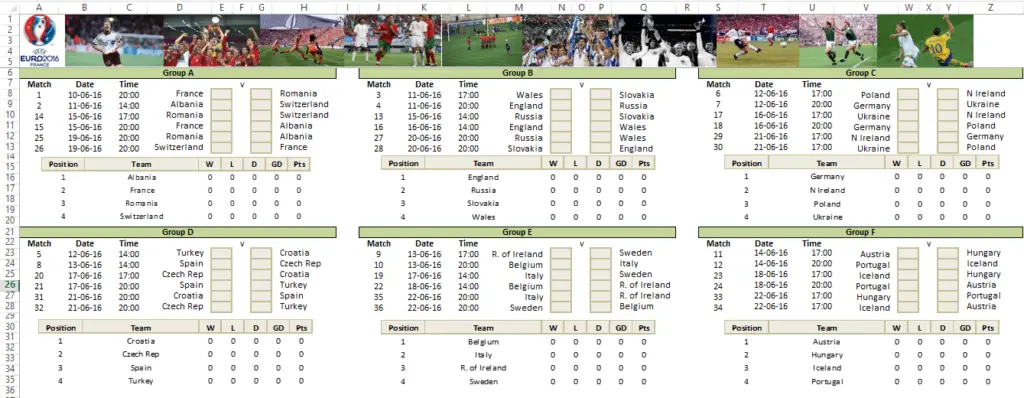
Euro 2016 is here and I have a Euro 2016 planner to share. The spreadsheet has a separate sheet for the group stage and the knockout stage. Enter the results into the boxes on the sheets and everything is calculated automatically.

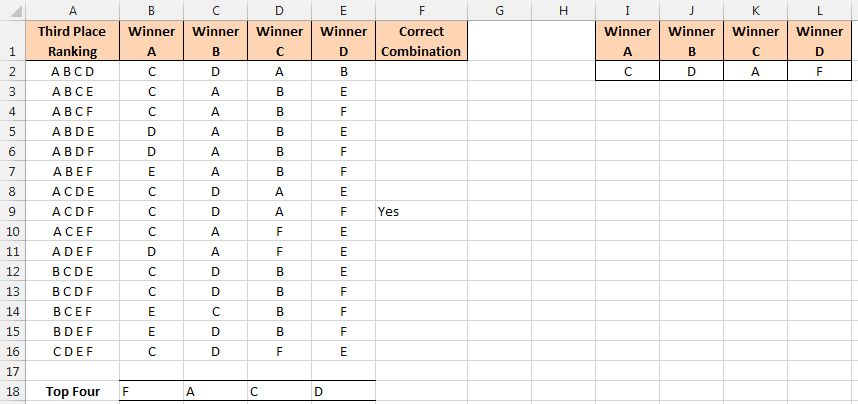
The group league tables are ranked as the results are entered. As soon as a groups fixtures have been completed, the knockout schedule is created. The quarters, semi-final and final fixtures are then calculated as these results are entered.
The spreadsheet is unlocked so you are free to check out the formulas and how it all works. Download the Euro 2016 planner spreadsheet.

Euro 2016 planner spreadsheet
[Read more…] about Euro 2016 Planner – Excel Template

Women’s World Cup 2015 Schedule – Excel Spreadsheet

The women’s World Cup is currently underway in Canada and at the time of writing have just finished the group stages of the competition.

This blog post provides a Women’s World Cup Schedule spreadsheet to automatically calculate the group stage rankings, and knockout stage schedule as the results are entered.

Download the Womens World Cup spreadsheet.

This spreadsheet is ready for use. All you need to do is enter the fixtures and results and it will take care of the rest.

What’s in the Workbook

The workbook is made up of 7 worksheets. Some of the worksheets are hidden as they are not needed when using the workbook. You can unhide these sheets by right clicking a sheet tab and selecting Unhide.

The following worksheets can be found in this World Cup schedule.

Teams – Stores the list of teams competing in the competition split into their groups.

Data – The number of points awarded for a win and draw in the groups stages.

Group Fixtures – The fixtures list and results during the group stages of the competition.

Calculations – Calculations for the group stage league table statistics such as number of wins, draw, losses goals for etc. It also calculates the teams league table rankings.

Third Place Rankings Table – Used to calculate the four best third placed teams during the group stages. It also calculates which teams they will face in round 16. This was quite complicated calculations and an explanation of how the schedule works can be seen below.

Group League Tables – The final group stage league tables. The VLOOKUP function is used to pull the information from the Calculations sheet, and use the ranking to list the teams in the correct order.

Knockout Stages – The fixtures and results for the knockout stage of the tournament. Formulas are used to determine which team progresses to the next round as results are entered.

How the Women’s World Cup Schedule Works

The first round is a group stage. Twenty four teams are divided into six groups of four teams. Each team plays one match against the other teams of the group. The group winners and runners-up progress along with the best four third-placed teams.

The ranking for each team in the group is determined by points, then by goal difference and then by goals scored.

Group stage tables and rankings

The spreadsheet also contains a table to calculate the best four third-placed teams. They are ranked in their own table using the same criteria.

This is similar to other sports tournament schedules I have created in Excel. You can learn all the skills used for this in our online course.

Scheduling the Best Four Third-Placed Teams

What really made this tournament schedule exciting to create were the tournament regulations for who the best four third-placed teams play in the next round.

These four teams are to be matched with the winners of groups A, B, C and D. However the group winners they play is dependent on which group the best four teams are from.

The image below of the ‘Third Placed Ranking Table’ sheet shows the rank order of the best four third-placed teams and the group winners they are paired against. This schedule is from section 28 of the tournament regulations.

Calculating the best third placed team

Row 18 displays the top four third-placed teams. A formula was used in column F to then calculate from this the correct schedule to use. This formula made use of the IF, NOT, ISERROR and FIND functions.

This combination was then extracted to a different area of the sheet using INDEX and MATCH. The ‘Knockout Stage’ schedule sheet then pulled the relevant team name across.

World Cup 2014 Flags Quiz

With the FIFA World Cup 2014 in full swing. Today I have another World Cup related post to share with you.

Are you good at recognising the flags of different countries? Well here is your chance to impress. This spreadsheet contains the flags of all 32 countries participating in the FIFA World Cup 2014. Your task is to name them.

Download the World Cup Flags Quiz spreadsheet.

World Cup 2014 flags quiz

What Excel techniques will I learn?

Learning the flags of different countries around the world is just the icing on the cake. Download this spreadsheet and check it out to also see these Excel techniques in action.

[Read more…] about World Cup 2014 Flags Quiz

FIFA World Cup History – Excel Dashboard

I have created a World Cup history dashboard full of fascinating statistics from the previous 20 world cups.

I find creating spreadsheets involving your passions a great way of developing and testing your Excel skills.

This dashboard incorporates a few different Excel dashboard techniques which are explained in this post.

The spreadsheet is completely unprotected so all the formulas and code can be explored.

Download the FIFA World Cup Excel Dashboard

[Read more…] about FIFA World Cup History – Excel Dashboard

Excel Gantt Chart Template for Tracking Project Tasks

A Gantt chart is used to plan and track the progress of a project. Although Excel does not contain a Gantt chart feature (maybe one day), its tabular structure and wealth of tools provide us with the means of creating one.

A Gantt chart can be created in many ways to match your requirements.

Using the Excel Gantt Chart Template

This Excel Gantt chart template uses fixed scheduling on its tasks and provides a timescale of 1 full year from the project start date. To use the template;

  1. Enter the project start date in cell E1.
  2. Enter the ID and name for the tasks of your project.
  3. Enter the task’s estimate start dates and durations.
  4. Enter the % completion to update the chart with the progress of the project.

Download the Excel Gantt chart template.

Completed Excel Gantt Chart template

Let’s look at what was used to build this Gantt chart in Excel.

[Read more…] about Excel Gantt Chart Template for Tracking Project Tasks
  • Page 1
  • Page 2
  • Go to Next Page »

Primary Sidebar

Recent Posts

  • Excel SWITCH Function – Nested IF Function Alternative
  • Sum Formulas Only in Excel
  • How to Calculate Age in Excel
  • Custom Sort in Excel
  • Case Sensitive Lookup with XLOOKUP in Excel
Advanced Excel Success book

Footer

Contact

[email protected]

LinkedIn Twitter YouTube

Useful Links

  • Home
  • Excel Online Courses
  • Tutorials
  • Sitemap
  • Privacy Policy
  • Jobs by Jooble

Course Topics

  • Blog
  • Charts
  • Courses
  • Dashboards
  • Downloads
  • Excel Tips
  • Formulas
  • Mail Merge
  • Office
  • PivotTables
  • Power BI
  • Power Pivot
  • Power Query
  • VBA

Join Our Mailing List

© Copyright 2009 Computergaga · All Rights Reserved ·