In Excel, it is possible to create a quick and effective visual that offers more flexibility than a traditional chart. With a clever combination of symbols, the REPT function, and a little formatting magic, you can build compact in-cell bar charts that are dynamic and informative.
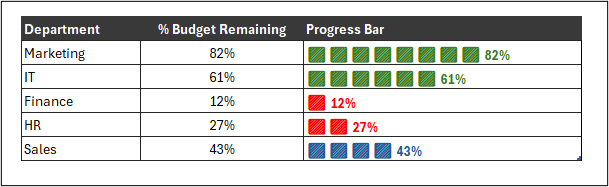
In this article, we will create a bar chart inside a cell, colour it based on custom performance thresholds and add values as data labels.
Let’s create the following dynamic bar chart without relying on standard chart tools.