• Skip to main content
  • Skip to primary sidebar
  • Skip to footer

Microsoft Excel Tips and Tricks - Computergaga

  • Home
  • Excel Online Courses
  • Excel Functions List
  • Free Downloads
  • Blog
  • Tutorials
  • About
Home / Archives for Dashboards

Conditional Formatting with Charts in Excel – Two Examples

You may already be familiar with the Conditional Formatting tool in Excel. The amazing tool that automatically formats values tat meet specific criteria and improves how we visualise our data. Unfortunately, there is no Conditional Formatting with charts in Excel.

However, there is a way to create a Conditional Formatting with charts effect in Excel. And the great news. It is not that difficult. A simple IF function or other to perform a test and produce the required value for the chart is all we need.

This blog post will look at two examples of Conditional Formatting with charts so that you get a feel for how to do it. You can then apply the same technique to whatever example you need.

Highlight a Column Based on User Selection

In the first example shown in the image below. We want to be able to highlight the column in each chart that corresponds to the product type selected by the user in cell B3.

Conditional Formatting with charts in Excel to highlight a selected value

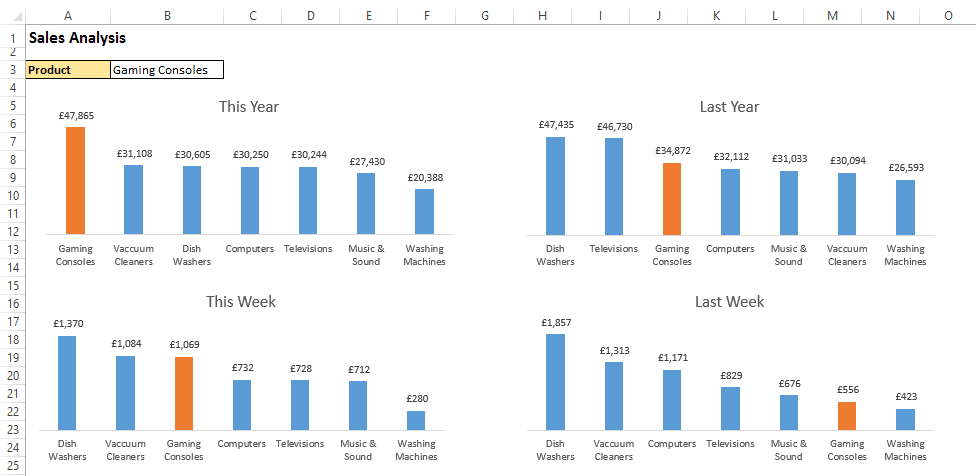
To achieve this we first need to add a column to the table which will show the value if the product type is selected by the user, but show the #N/A error if it is not.

The IF function is used to perform this logical test and required actions. The NA() function is used to return the #N/A error if it is not the product type selected. This is done because the chart will not plot error values, so it essentially hides those values on the chart.

The formula below is the one entered into cell C4. It compares the product name against the one selected by the user in B3 of the Sales By Product worksheet. It then displays the value in cell B4 if it is a match, or shows the error value if not.

[Read more…] about Conditional Formatting with Charts in Excel – Two Examples

Create a Rolling Chart for Last 6 Months

When creating reports in Excel, a common requirement is to report on a rolling basis. For example, this could mean the last 12 months, the last 6 weeks or the last 7 days. In this tutorial, we create a rolling chart in Excel to produce a report like this.

Whatever the timeframe being reported, this can mean a lot of time editing chart sources and formulas to show the right data.

This blog post looks at creating a dynamic rolling chart in Excel to show the last 6 months of data, so when new data is added to the table, the chart automatically updates to report the last 6 rows (months).

To create a rolling chart, we will first create two dynamic named ranges. These will automatically capture the last 6 months data. One named range for the chart data, and the other for its labels. We will then use these named names for our chart source.

[Read more…] about Create a Rolling Chart for Last 6 Months

Highlight Max and Min Values on a Column Chart

When using column charts to compare values, you may want to highlight the max and min values on the chart. By highlighting the maximum and minimum values, it removes any confusion identifying the top and bottom values.

Highlight max and min values on a column chart

Finding the Max and Min Values

To show the max and min values on a column chart, we will first need to identify the max and min values of our range. These values will then be used as a second data series when we create the column chart.

We will use the following formula to check the values in our range, and return the value if it is the maximum or minimum. Otherwise the NA() function is used to return the #N/A error. We want this because the chart will not plot these error values.

[Read more…] about Highlight Max and Min Values on a Column Chart

FIFA World Cup History – Excel Dashboard

I have created a World Cup history dashboard full of fascinating statistics from the previous 20 world cups.

I find creating spreadsheets involving your passions a great way of developing and testing your Excel skills.

This dashboard incorporates a few different Excel dashboard techniques which are explained in this post.

The spreadsheet is completely unprotected so all the formulas and code can be explored.

Download the FIFA World Cup Excel Dashboard

[Read more…] about FIFA World Cup History – Excel Dashboard

Create a Scrollable Chart for your Excel Dashboards

Creating a scrollable chart in Excel is a great chart trick for enhancing the functionality of your Excel dashboards. You may have years of data to display in the chart, and yet space is limited on your spreadsheet.

By adding a scroll bar to the chart, users can interact with the chart and scroll to see the data they want displayed.

In this example, we have a spreadsheet with revenue for the last 23 months. As this is a lot of data to plot, we have decided that the chart will only display 5 months at a time. A scroll bar will be added so that users can scroll through the years.

Skip to watching the video.

[Read more…] about Create a Scrollable Chart for your Excel Dashboards
  • « Go to Previous Page
  • Page 1
  • Page 2

Primary Sidebar

Recent Posts

  • Excel SWITCH Function – Nested IF Function Alternative
  • Sum Formulas Only in Excel
  • How to Calculate Age in Excel
  • Custom Sort in Excel
  • Case Sensitive Lookup with XLOOKUP in Excel
Advanced Excel Success book

Footer

Contact

[email protected]

LinkedIn Twitter YouTube

Useful Links

  • Home
  • Excel Online Courses
  • Tutorials
  • Sitemap
  • Privacy Policy
  • Jobs by Jooble

Course Topics

  • Blog
  • Charts
  • Courses
  • Dashboards
  • Downloads
  • Excel Tips
  • Formulas
  • Mail Merge
  • Office
  • PivotTables
  • Power BI
  • Power Pivot
  • Power Query
  • VBA

Join Our Mailing List

© Copyright 2009 Computergaga · All Rights Reserved ·