• Skip to main content
  • Skip to primary sidebar
  • Skip to footer

Microsoft Excel Tips and Tricks - Computergaga

  • Home
  • Excel Online Courses
  • Excel Functions List
  • Free Downloads
  • Blog
  • Tutorials
  • About
Home / Archives for Charts

Create a Rolling Chart for Last 6 Months

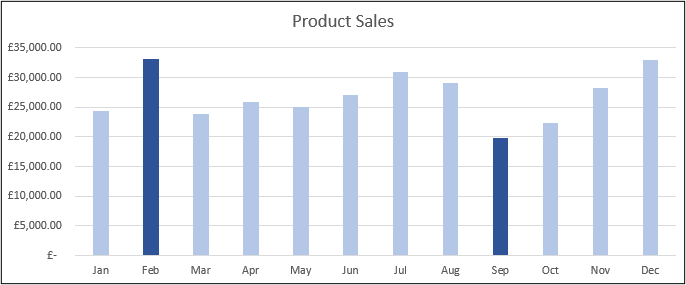
When creating reports in Excel, a common requirement is to report on a rolling basis. For example, this could mean the last 12 months, the last 6 weeks or the last 7 days. In this tutorial, we create a rolling chart in Excel to produce a report like this.

Whatever the timeframe being reported, this can mean a lot of time editing chart sources and formulas to show the right data.

This blog post looks at creating a dynamic rolling chart in Excel to show the last 6 months of data, so when new data is added to the table, the chart automatically updates to report the last 6 rows (months).

To create a rolling chart, we will first create two dynamic named ranges. These will automatically capture the last 6 months data. One named range for the chart data, and the other for its labels. We will then use these named names for our chart source.

[Read more…] about Create a Rolling Chart for Last 6 Months

Highlight Max and Min Values on a Column Chart

When using column charts to compare values, you may want to highlight the max and min values on the chart. By highlighting the maximum and minimum values, it removes any confusion identifying the top and bottom values.

Highlight max and min values on a column chart

Finding the Max and Min Values

To show the max and min values on a column chart, we will first need to identify the max and min values of our range. These values will then be used as a second data series when we create the column chart.

We will use the following formula to check the values in our range, and return the value if it is the maximum or minimum. Otherwise the NA() function is used to return the #N/A error. We want this because the chart will not plot these error values.

[Read more…] about Highlight Max and Min Values on a Column Chart

Add Drop Lines to a Line Graph in Excel

Add drop lines to a line graph in Excel to connect the data point to its label on the axis. This extra visual chart element can make it easier to view the data on busy charts.

Take the line graph below for instance that shows the call volume for 14 hours of a day. It can be awkward on this chart to quickly view the time of day for a specific data point.

Line graph with call volume data
[Read more…] about Add Drop Lines to a Line Graph in Excel

Battery Chart in Excel

Create a battery chart in Excel just like you see on your smartphone, tablet device or even PC. It is a great visual way of viewing the percentage remaining of a value.

In Excel, a battery chart could be used to view the amount remaining of a budget, the work remaining on a task, or number of people still to attend training.

There are many reasons why you may want to visualise an amount dropping until it is empty, or complete. A battery chart provides a method that people can relate to easily.

The image below shows a battery chart being used to show the amount outstanding on a training budget.

Battery chart in Excel to view training budget remaining

In this tutorial, we will look at how to create a battery chart in Excel, just like the one above.

[Read more…] about Battery Chart in Excel

Animate a Chart in Excel

Animate a chart in Excel to create a cool effect for your charts. You will see the chart build itself in front of your very eyes.

The chart can be created in the usual way and then VBA is used to create the animation effect.

In this example a combo box is used to provide a way for the user to select the chart they want to see. The chart then gradually appears one data point at a time.

[Read more…] about Animate a Chart in Excel
  • « Go to Previous Page
  • Page 1
  • Page 2
  • Page 3
  • Go to Next Page »

Primary Sidebar

Recent Posts

  • Excel SWITCH Function – Nested IF Function Alternative
  • Sum Formulas Only in Excel
  • How to Calculate Age in Excel
  • Custom Sort in Excel
  • Case Sensitive Lookup with XLOOKUP in Excel
Advanced Excel Success book

Footer

Contact

[email protected]

LinkedIn Twitter YouTube

Useful Links

  • Home
  • Excel Online Courses
  • Tutorials
  • Sitemap
  • Privacy Policy
  • Jobs by Jooble

Course Topics

  • Blog
  • Charts
  • Courses
  • Dashboards
  • Downloads
  • Excel Tips
  • Formulas
  • Mail Merge
  • Office
  • PivotTables
  • Power BI
  • Power Pivot
  • Power Query
  • VBA

Join Our Mailing List

© Copyright 2009 Computergaga · All Rights Reserved ·