Set a baseline for your project so that you can track its progress against the original project plan. A baseline is a reference point for the project schedule. It can be used to measure the project progress in certain categories.
The baseline saves nearly 20 reference points in 5 different categories for all the tasks in your project. These are the Start Dates, Finish Dates, Durations, Work and Cost. For an effective baseline you should ensure that these estimates are accurate in your project before you set the baseline.
Set a Baseline for the Project
- Click the Tools menu, select Tracking and click Set Baseline
- Ensure Set Baseline is selected for the first option
- In the For section choose the set a baseline for the Entire project, or for Selected tasks
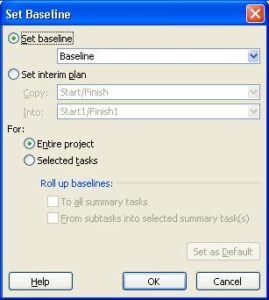
You can set up to 11 baselines so that you can measure project progress against interim points in your project.
Analyse Baseline Data
Once a project’s baseline data has been saved, it can be used to analyse project performance.
Microsoft Project provides many ways for you to analyse and measure progress. Here are two;
View Baseline Information in Project Statistics
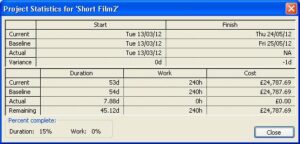
The Project Statistics window enables you to compare the actual and baseline data of vital statistics for your project.
- Click the Project menu and select Project Information
- Click the Statistics button
The image below shows the Project Statistics window and the variance between the actual and baseline duration of the project.
Measure the Actual Data Against the Baseline Schedule using the Tracking Gantt
The Tracking Gantt allows you to easily compare the project schedule against the initial plan. The variance between the task bars is easy to track.
The image below shows the variance between the baseline bar (above) and the actual data (below). It shows that the tasks are a little behind schedule.

Setting a baseline provides reference points that you can use to measure your project progress against. Microsoft Project provides many ways of analysing its progress and make use of this baseline data.


Leave a Reply